By Kara Nyberg, PhD
Posted: August 19, 2020
A multitude of factors contribute to disparities in lung cancer care, including sex, race, education level, income, geographic region, and access to care. “There are some systemic barriers that make it difficult for people to obtain equitable treatment by race and class in the United States,” regardless of the type of disease, according to Christopher Lathan, MD, MPH, Medical Director of the Dana-Farber Cancer Institute at St. Elizabeth’s Medical Center and Faculty Director for Cancer Care Equity. These disparities are exacerbated in lung cancer because socioeconomic status and race represent major determinants of smoking, the leading cause of the disease.
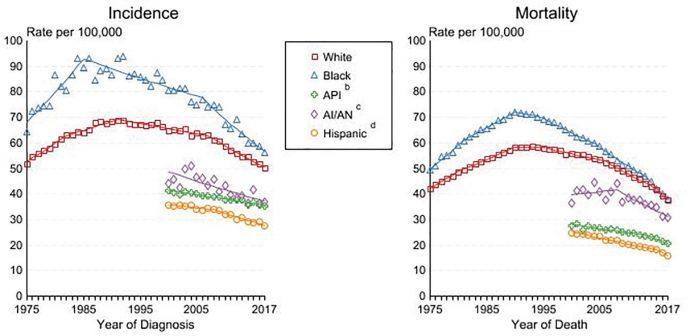
Although change has been slow, improvements in lung cancer disparities are beginning to emerge on several levels, particularly over the last 5 years. If we look at race, the most conspicuous and topical disparity based on recent events worldwide, lung cancer incidence and mortality have continued to steadily decline in the United States across all races, with diminishing gaps between white and black individuals (Figure 1).

a Rates are age-adjusted to the 2000 US Std Population (19 age groups – Census P25-1103).
Regression lines are calculated using the Joinpoint Regression Program Version 4.8, April 2020, National Cancer Institute. Joinpoint analyses for white and black individuals during the 1975-2017 period allow a maximum of 5 joinpoints. Analysis for other ethnic groups during the period 1975-2017 allows a maximum of 3 joinpoints.
b API = Asian/Pacific Islander.
c AI/AN = American Indian/Alaska Native. Rates for American Indian/Alaska Native are based on the Purchased/Referred Care Delivery Area (PRCDA) counties.
d Hispanic is not mutually exclusive from whites, blacks, Asian/Pacific Islanders, and American Indians/Alaska Natives. Incidence data for Hispanics are based on NHIA and exclude cases from the Alaska Native Registry.
Source: Incidence data for white and black individuals are from the SEER 9 areas (San Francisco, Connecticut, Detroit, Hawaii, Iowa, New Mexico, Seattle, Utah, Atlanta). Incidence data for Asian/Pacific Islanders, American Natives, and Hispanics are from the SEER 21 areas (SEER 9 areas, San Jose-Monterey, Los Angeles, Alaska Native Registry, Rural Georgia, California excluding SF/SJM/LA, Kentucky, Louisiana, New Jersey, Georgia excluding ATL/RG, Idaho, New York, and Massachusetts).


